
计算物理 ›› 2023, Vol. 40 ›› Issue (2): 258-274.DOI: 10.19596/j.cnki.1001-246x.8599
所属专题: 贺贤土院士从事科学研究工作60周年暨激光聚变相关研究进展专刊
• 贺贤土院士从事科学研究工作60周年暨激光聚变相关研究进展专刊 • 上一篇
颜子翔1,2( ), 康炜2,3,*(), 张维岩2,4, 贺贤土2,5
收稿日期:2022-07-23
出版日期:2023-03-25
发布日期:2023-07-05
通讯作者:
康炜
作者简介:颜子翔, 男, 讲师, 研究方向为温稠密物质物性的数值模拟, E-mail: yanzx950112@163.com
Zixiang YAN1,2(), Wei KANG2,3,*(), Weiyan ZHANG2,4, Xiantu HE2,5
Received:2022-07-23
Online:2023-03-25
Published:2023-07-05
Contact:
Wei KANG
摘要:
首先对路径积分蒙特卡罗(PIMC)方法的基本原理进行详细介绍, 重点综述该方法处理费米系统的手段。然后对PIMC方法在计算多种体系的状态方程所取得的成果进行总结比较, 分析该方法的优点与不足。最后对PIMC方法未来的发展方向做出展望。
颜子翔, 康炜, 张维岩, 贺贤土. 温稠密物质状态方程的路径积分蒙特卡罗方法研究进展[J]. 计算物理, 2023, 40(2): 258-274.
Zixiang YAN, Wei KANG, Weiyan ZHANG, Xiantu HE. Progress in Study of Equation of State of Warm Dense Matter with Path-integral Monte Carlo Method[J]. Chinese Journal of Computational Physics, 2023, 40(2): 258-274.
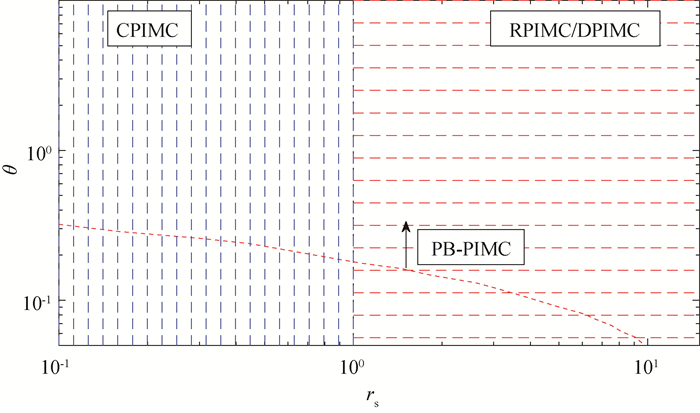
图1 不同PIMC模拟覆盖到的均匀电子气体参数范围(横轴为描述密度的无量纲参数$ r_{\mathrm{s}}=a / a_0$,a为自由电子气体中电子的平均间距,a0为玻尔半径,纵轴为描述温度的无量纲参数Θ=T/TF,TF为费米温度。红色点线表示PB-PIMC方法覆盖的温度范围的下界。)
Fig.1 The ranges of applicability for different PIMC method in the study of UEG (The density parameter $ r_{\mathrm{s}}=a / a_0$ with a the average distance of electrons and a0 the Bohr radius, and the temperature parameter $\varTheta=T / T_{\mathrm{F}} $ with TF the Fermi temperature.)
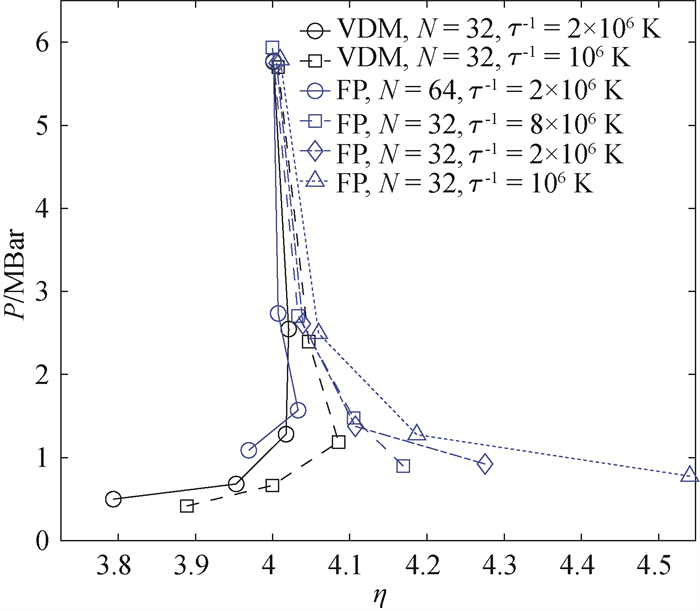
图2 RPIMC模拟得到的氘的冲击雨贡纽曲线[47](图中不同标记的数据点表示采用了不同组合的虚时步长、粒子数以及节点形式的计算结果。)
Fig.2 Hugoniot curve of deuterium calculated with RPIMC method[47] (Data points in different colors and marks represent the results calculated with different time steps τ, particle number N and nodal types.)
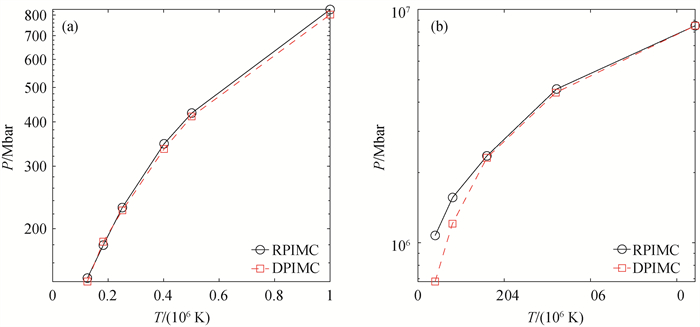
图3 等密度下温稠密氘的压强随温度的变化(a) ρ = 10.00 g ·cm-3;(b) ρ = 1 596.49 g ·cm-3 (红色方块表示DPIMC模拟结果[46],黑色圆圈则表示RPIMC的模拟结果[47]。)
Fig.3 Temperature dependence of deuterium's pressure at constant density of (a) ρ = 10.00 g ·cm-3 and (b) ρ = 1 596.49 g ·cm-3 (The black circles stand for the RPIMC results[47], while the red squares represent the DPIMC results[46].)
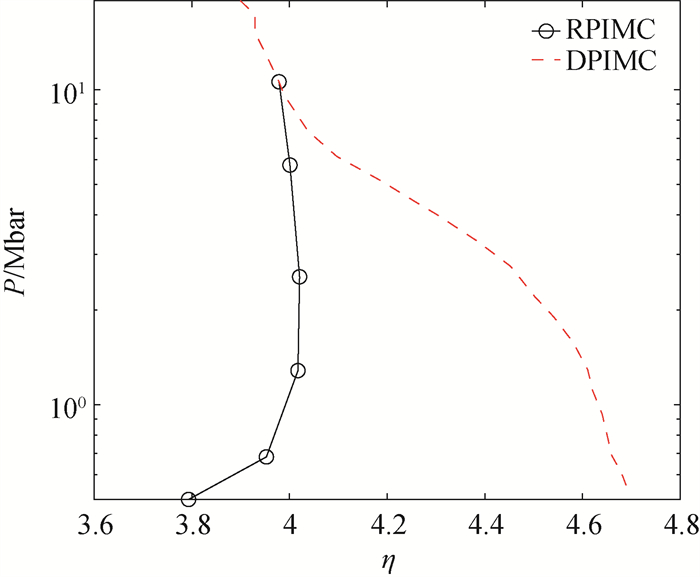
图4 DPIMC模拟得到的氘的冲击雨贡纽曲线[86](红色虚线)与RPIMC的模拟结果[47](黑色实线)对比
Fig.4 Hugoniot curve of deuterium calculated with DPIMC method[86], as represented by the red dashed curve. The results of RPIMC simulation[47] are also presented with the black curve, for the comparison purpose
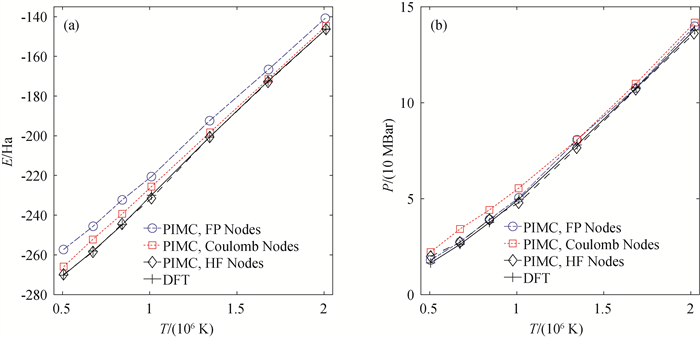
图5 (a) 单一硅原子的内能随温度的变化[61] (模拟采用的周期性边界盒子边长为5.0 Bohr。图中彩色的数据点表示采用各种节点形式的计算结果,作为参照的密度泛函理论(DFT)计算结果由黑色十字表示。); (b) 单一硅原子的压强随温度的变化(图中不同标记的数据点的含义与图(a)一致。)
Fig.5 (a) Temperature dependence of internal energy of a single silicon atom[61] (Periodic cell of 5.0 Bohr is employed in simulation. The data points in different marks represent the results calculated with different nodes. The density functional theory (DFT) results are also shown as the reference, as represented by the black crosses.); (b) Temperature dependence of pressure of a single silicon atom
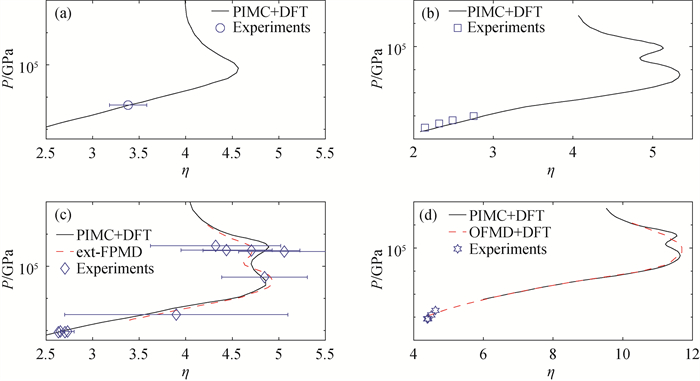
图6 中Z材料的冲击雨贡纽曲线(a)硼的雨贡纽曲线(黑色实线为RPIMC+DFT-MD模拟给出的结果[51],蓝色圆圈为实验结果[51]。);(b)钠的雨贡纽曲线(黑色实线为RPIMC+DFT-MD模拟给出的结果[57],蓝色方块为文献[57]中引用的实验结果。);(c)铝的雨贡纽曲线(黑色实线为RPIMC+DFT-MD模拟给出的结果[60],红色虚线为ext-FPMD方法给出的结果[23],蓝色菱形为文献[60]中引用的实验结果。);(d)硅的雨贡纽曲线(黑色实线为RPIMC+DFT-MD模拟给出的结果[62],红色虚线为OFMD+DFT-MD方法给出的结果[62],蓝色六边形为文献[62]中引用的实验结果。)
Fig.6 Hugoniot curves of middle Z materials. (a) Hugoniot curve of Boron (The black curve and blue circles represent the results of RPIMC+DFT-MD[51] and experiments[51].); (b) Hugoniot curve of Sodium (The black curve and blue squares represent the results of RPIMC+DFT-MD[57] and the experiments cited within Ref. [57].); (c) Hugoniot curve of Aluminum (The black curve, red dashed curve and blue squares represent the results of RPIMC+DFT-MD[60], ext-FPMD[23] and the experiments cited within Ref. [60].); (d) Hugoniot curve of Silicon (The black curve, red dashed curve and blue squares represent the results of RPIMC+DFT-MD[62], OFMD+DFT-MD[62] and the experiments cited within Ref. [62].)
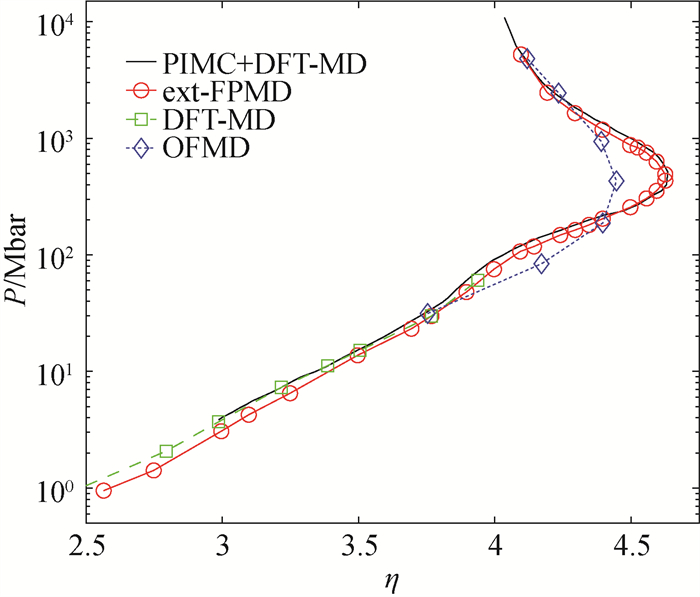
图7 碳氢材料的冲击雨贡纽曲线(黑色实线为RPIMC+ DFT-MD模拟给出的结果[66],红色圆圈为ext-FPMD方法给出的结果[24],绿色方块为DFT-MD模拟给出的结果[88],蓝色菱形为OFMD模拟给出的结果[88]。)
Fig.7 Hugoniot curve of Hydrocarbon (CH) (The black curve, red circles, green squares, and blue diamonds represent the results of RPIMC+DFT-MD[66], ext-FPMD[24], DFT-MD[88] and OFMD[88], respectively.)
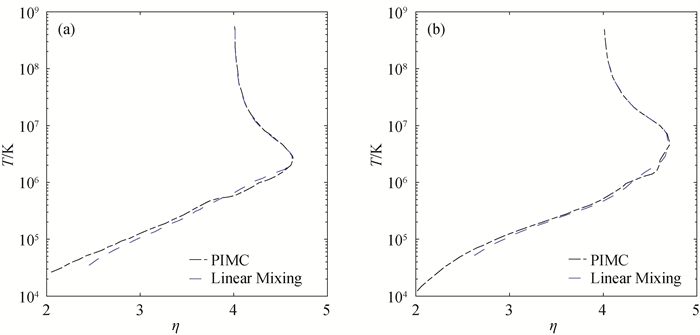
图8 (a) 氮化硼的雨贡纽曲线[89](红色实线表示直接进行PIMC模拟的结果,其中氮化硼初始密度为2.26 g ·cm-3,蓝色点划线表示在同密度下采用线性混合近似得到的结果。);(b)硅酸镁的雨贡纽曲线[89](红色实线表示直接进行PIMC模拟的结果,其中硅酸镁初始密度为3.208g ·cm-3,绿色点划线表示在同密度下采用线性混合近似得到的结果。)
Fig.8 (a) Hugoniot curve of boron nitride (BN)[89] (The red curve represents the direct result of BN through RPIMC simulations with an initial density of 2.26g ·cm-3. The blue dash dot line represents the result with linear mixed approximation of elemental B and N.); (b) Hugoniot curve of magnesium silicate (MgSiO3)[89] (The red curve represents the RPIMC result of MgSiO3 with an initial density of 3.208 g ·cm-3, while the green dash dot curve represents the result with linear mixed approximation of elemental Mg, Si, and O.)
| 1 |
|
| 2 |
DOI |
| 3 |
DOI |
| 4 |
DOI |
| 5 |
|
| 6 |
DOI |
| 7 |
DOI |
| 8 |
DOI |
| 9 |
|
| 10 |
DOI |
| 11 |
|
| 12 |
DOI |
| 13 |
DOI |
| 14 |
DOI |
| 15 |
李儒新. 上海超强超短激光实验装置研制进展[J]. 强激光与粒子束, 2020, 32 (1): 011002.
|
| 16 |
DOI |
| 17 |
DOI |
| 18 |
DOI |
| 19 |
DOI |
| 20 |
DOI |
| 21 |
DOI |
| 22 |
DOI |
| 23 |
DOI |
| 24 |
DOI |
| 25 |
DOI |
| 26 |
DOI |
| 27 |
MILITZER B. Path integral Monte Carlo simulations of hot dense hydrogen[D]. Urbana, University of Illinois at Urbana-Champaign, 2000.
|
| 28 |
DOI |
| 29 |
DOI |
| 30 |
LYON S P, JOHNSON J D. SESAME: The Los Alamos national laboratory equation of state database[R]. Group T-1, Report No. LA-UR-92-3407, Los Alamos Scientific Laboratory, 1992.
|
| 31 |
DOI |
| 32 |
|
| 33 |
DOI |
| 34 |
DOI |
| 35 |
|
| 36 |
DOI |
| 37 |
|
| 38 |
DOI |
| 39 |
DOI |
| 40 |
|
| 41 |
ALLEN M P, TILDESLEY D J. Computer simulation of liquids[M]. Oxford, Clarendon press, 1989: 155-162.
|
| 42 |
DOI |
| 43 |
DOI |
| 44 |
CEPERLEY D M. Path-integral calculations of normal liquid 3He[J]. Phys Rev Lett, 69: 331-334.
|
| 45 |
DOI |
| 46 |
|
| 47 |
DOI |
| 48 |
DOI |
| 49 |
DOI |
| 50 |
DOI |
| 51 |
DOI |
| 52 |
DOI |
| 53 |
DOI |
| 54 |
DOI |
| 55 |
DOI |
| 56 |
DOI |
| 57 |
DOI |
| 58 |
DOI |
| 59 |
DOI |
| 60 |
DOI |
| 61 |
DOI |
| 62 |
DOI |
| 63 |
DOI |
| 64 |
DOI |
| 65 |
DOI |
| 66 |
DOI |
| 67 |
DOI |
| 68 |
DOI |
| 69 |
DOI |
| 70 |
DOI |
| 71 |
|
| 72 |
DOI |
| 73 |
DOI |
| 74 |
DOI |
| 75 |
ZAN Xiaolei. Path integral Monte Carlo simulations of the warm dense electron systems[D]. Changsha: National University of Defense Technology, 2017.
|
| 76 |
DOI |
| 77 |
DOI |
| 78 |
DOI |
| 79 |
DOI |
| 80 |
DOI |
| 81 |
DOI |
| 82 |
DOI |
| 83 |
DOI |
| 84 |
DOI |
| 85 |
|
| 86 |
|
| 87 |
DOI |
| 88 |
DOI |
| 89 |
DOI |
| 90 |
DOI |
| 91 |
DOI |
| [1] | 吴宗铎, 满庆洋, 严谨, 庞建华, 孙一方. 三介质Mie-Grüneisen混合模型在水下爆炸防护层问题中的应用[J]. 计算物理, 2023, 40(5): 556-569. |
| [2] | 牛霄, 倪国喜, 马文铧. 自适应多分辨率方法在反应多相流数值模拟中的应用[J]. 计算物理, 2020, 37(6): 639-652. |
| [3] | 张其黎, 刘海风, 李琼, 宋红州, 张弓木. 氢状态方程的路径积分蒙特卡罗研究[J]. 计算物理, 2019, 36(4): 379-385. |
| [4] | 孟续军, 王瑞利. 含温有界原子理论体系下电子状态方程不确定度的量化计算[J]. 计算物理, 2018, 35(2): 138-150. |
| [5] | 许亮, 冯成亮, 刘铁钢. 虚拟流体方法的设计原则[J]. 计算物理, 2016, 33(6): 671-680. |
| [6] | 杭旭登, 李双贵, 杨容, 袁光伟. 分片光滑物态方程的能量方程非线性迭代解法[J]. 计算物理, 2015, 32(5): 505-513. |
| [7] | 唐维军, 蒋浪, 程军波. 多组份流动质量分数保极值原理算法[J]. 计算物理, 2014, 31(3): 292-306. |
| [8] | 梁仙红, 李征, 何长江, 刘超. 多介质流体力学两步欧拉方法的模型封闭性方法[J]. 计算物理, 2010, 27(5): 658-664. |
| [9] | 郑建国, 马东军, 孙德军, 尹协远. Van der Waals状态方程可压缩多流体流动的PPM目的[J]. 计算物理, 2007, 24(3): 287-294. |
| [10] | 王庭辉, 宋顺成. Grüneisen状态方程的数值解及其应用[J]. 计算物理, 2007, 24(3): 361-366. |
| [11] | 马东军, 孙德军, 尹协远. 一维多介质可压缩流动数值方法[J]. 计算物理, 2003, 20(2): 183-188. |
| [12] | 王义. 铂Hugoniot曲线的Ab initio计算[J]. 计算物理, 2000, 17(S1): 1-5. |
| [13] | 盛宏玉, 范家让. 具有固支边的强厚度层合板的一种新解法[J]. 计算物理, 1999, 16(6): 682-687. |
| [14] | 孙凤国, 胡洪波, 唐荣奇. 二维硬盘系统状态方程和相图的数值计算[J]. 计算物理, 1992, 9(1): 35-39. |
| 阅读次数 | ||||||
|
全文 |
|
|||||
|
摘要 |
|
|||||
版权所有 © 《计算物理》编辑部
地址:北京市海淀区丰豪东路2号 邮编:100094 E-mail:jswl@iapcm.ac.cn
本系统由北京玛格泰克科技发展有限公司设计开发